14. パラレルセットグラフ#
14.1. 概要#
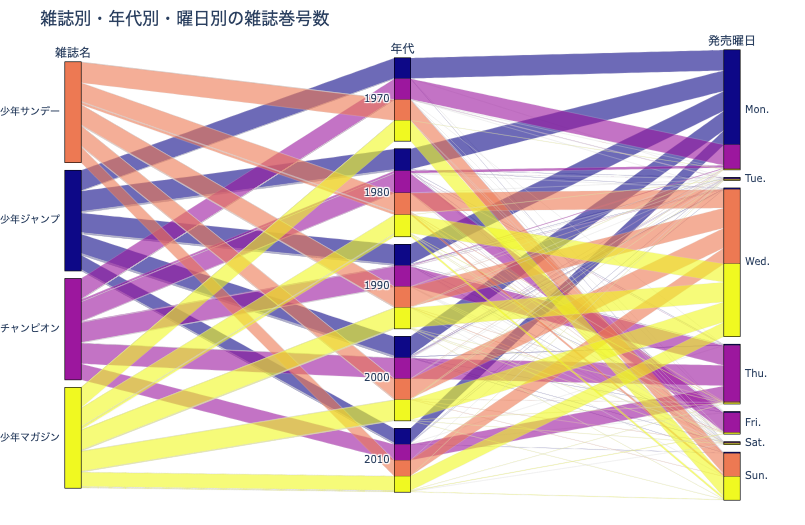
パラレルセットグラフ(Parallel Set Graph) とは,複数の質的変数に対して,それらの比率を 平行棒の面積 で表現するグラフです. 三つ以上の質的変数に対しても適用可能であるという利点があります. パラレルセットグラフを作成する上でのポイントは,最も強調したい質的変数を左側に配置し,かつ色付けすることです.

例えば上図は,雑誌名・年代・発売曜日ごとの雑誌巻号数の比率を表したパラレルセットグラフです. ここでは特に 各雑誌が 各年代・各曜日にどのように販売されているか表現したかったため,雑誌名を一番左に配置しています.
14.2. Plotlyによる作図方法#
Plotlyにおいては,plotly.express.parallel_categories()でパラレルセットグラフを作成できます.
import plotly.express as px
fig = px.parallel_categories(
df, dimensions=['col_0', 'col_1', 'col_2'],
color='col_0)
上記の例では,dfのcol_0・col_1・col_2列に対するパラレルセットグラフのオブジェクトfigを作成します.
このとき,左からcol_0→col_1→col_2の順序で配置され,かつcol_0列を基準に色分けされます.
14.3. MADB Labを用いた作図例#
14.3.1. 下準備#
import pandas as pd
import plotly.express as px
import warnings
warnings.filterwarnings('ignore')
# 前処理の結果,以下に分析対象ファイルが格納されていることを想定
PATH_DATA = '../../data/preprocess/out/episodes.csv'
# Jupyter Book用のPlotlyのrenderer
RENDERER = 'plotly_mimetype+notebook'
# weekdayを曜日に変換
WD2STR = {
0: 'Mon.',
1: 'Tue.',
2: 'Wed.',
3: 'Thu.',
4: 'Fri.',
5: 'Sat.',
6: 'Sun.',}
def add_years_to_df(df, unit_years=10):
"""unit_years単位で区切ったyears列を追加"""
df_new = df.copy()
df_new['years'] = \
pd.to_datetime(df['datePublished']).dt.year \
// unit_years * unit_years
df_new['years'] = df_new['years'].astype(str)
return df_new
def add_weekday_to_df(df):
"""曜日情報をdfに追加"""
df_new = df.copy()
df_new['weekday'] = \
pd.to_datetime(df_new['datePublished']).dt.weekday
df_new['weekday_str'] = df_new['weekday'].apply(
lambda x: WD2STR[x])
return df_new
def add_mcid_to_df(df):
"""mcnameのindexをdfに追加"""
df_new = df.copy()
mcname2mcid = {
x: i for i, x in enumerate(df['mcname'].unique())}
df_new['mcid'] = df_new['mcname'].apply(
lambda x: mcname2mcid[x])
return df_new
def show_fig(fig):
"""Jupyter Bookでも表示可能なようRendererを指定"""
fig.update_layout(margin=dict(t=50, l=25, r=25, b=25))
fig.show(renderer=RENDERER)
df = pd.read_csv(PATH_DATA)
14.3.2. 雑誌別・年代別・曜日別の雑誌巻号数#
# 10年単位で区切ったyearsを追加
df_plot = df[~df['miname'].duplicated()].reset_index(drop=True)
df_plot = add_years_to_df(df_plot, 10)
df_plot = add_weekday_to_df(df_plot)
df_plot = add_mcid_to_df(df_plot)
df_plot = df_plot.sort_values(
['weekday', 'years', 'mcname'], ignore_index=True)
fig = px.parallel_categories(
df_plot, dimensions=['mcname', 'years', 'weekday_str'],
color='mcid',
labels={
'years': '年代', 'mcname': '雑誌名',
'weekday_str': '発売曜日'},
title='雑誌別・年代別・曜日別の雑誌巻号数')
fig.update_coloraxes(showscale=False)
show_fig(fig)
当たり前ですが,各雑誌の巻号数は年代ごとにほぼ同一であることがわかります. 一方で発売日は非常に興味深いです.
週刊少年サンデーと週刊少年マガジン:1970年代は日曜に,1980年代以降は水曜に発売されているように見える週刊少年チャンピオン:1970年代は月曜に,1980年代は金曜に,そして1990年代以降は木曜に発売されているように見える週刊少年ジャンプ:1970年代から現在に至るまで,基本的に月曜に発売されているように見える
Note
上記はdatePublishedに基づく分析結果ですが,私が調べた限り,これを裏付けるような情報はありませんでした.
私がdatePublishedの解釈を誤っている可能性がありますので,ご注意ください.
# 試しに5年区切りでプロットしてみる
df_plot = df[~df['miname'].duplicated()].reset_index(drop=True)
df_plot = add_years_to_df(df_plot, 5)
df_plot = add_weekday_to_df(df_plot)
df_plot = add_mcid_to_df(df_plot)
df_plot = df_plot.sort_values(
['weekday', 'years', 'mcname'], ignore_index=True)
fig = px.parallel_categories(
df_plot, dimensions=['mcname', 'years', 'weekday_str'],
color='mcid',
labels={
'years': '年代', 'mcname': '雑誌名',
'weekday_str': '発売曜日'},
title='雑誌別・年代別・曜日別の雑誌巻号数')
fig.update_coloraxes(showscale=False)
show_fig(fig)
