6. バイオリンプロット#
6.1. 概要#
バイオリンプロット(Violin Plot) とは,主に量的変数に対して,分布を滑らかな 曲線 で表現するグラフです. 密度プロットを90°回転したものを,複数の変数に対して描画します(縦横が反転することもあります). 箱ひげ図ほど分布形状の情報を落とさずに,複数の分布を容易に比較できるという利点があります. 箱ひげ図やストリッププロットと組合せて描画されることもあります.
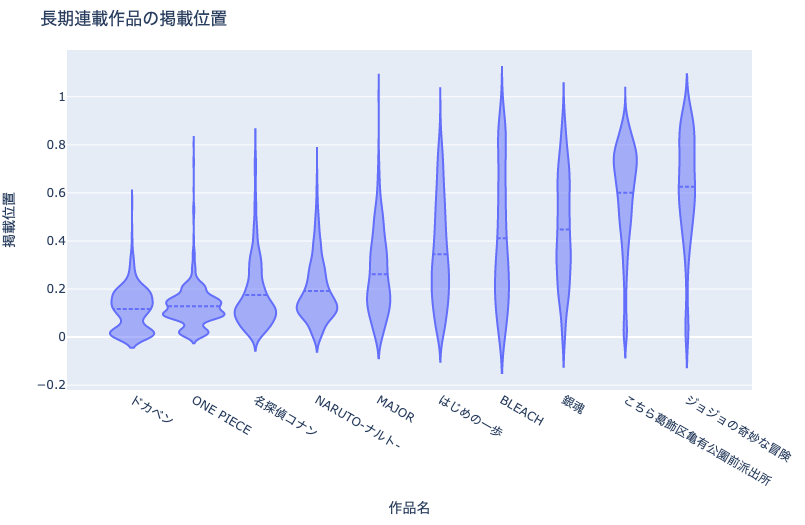
例えば上図は,作品ごとの掲載位置の分布を表現したバイオリンプロットです.
6.2. Plotlyによる作図方法#
Plotlyでは,plotly.express.violin()でヒストグラムを作成可能です.
import plotly.express as px
fig = px.violin(df, x='col_x', y='col_y')
上記の例では,dfのcol_xを横軸,col_yを縦軸に取ったバイオリンプロットのオブジェクトfigを作成します.
6.3. MADB Labを用いた作図例#
6.3.1. 下準備#
import pandas as pd
import plotly.express as px
import warnings
warnings.filterwarnings('ignore')
# 前処理の結果,以下に分析対象ファイルが格納されていることを想定
PATH_DATA = '../../data/preprocess/out/episodes.csv'
# Jupyter Book用のPlotlyのrenderer
RENDERER = 'plotly_mimetype+notebook'
# 平均掲載位置を算出する際の最小連載数
MIN_WEEKS = 5
def show_fig(fig):
"""Jupyter Bookでも表示可能なようRendererを指定"""
fig.update_layout(margin=dict(t=50, l=25, r=25, b=25))
fig.show(renderer=RENDERER)
df = pd.read_csv(PATH_DATA)
6.3.2. 長期連載作品の掲載位置の分布#
df_tmp = \
df.groupby('cname')['pageStartPosition']\
.agg(['count', 'mean']).reset_index()
df_tmp = \
df_tmp.sort_values('count', ascending=False, ignore_index=True)\
.head(10)
cname2position = df_tmp.groupby('cname')['mean'].first().to_dict()
df_plot = df[df['cname'].isin(list(cname2position.keys()))]\
.reset_index(drop=True)
df_plot['position'] = df_plot['cname'].apply(
lambda x: cname2position[x])
df_plot = df_plot.sort_values('position', ignore_index=True)
fig = px.violin(
df_plot, x='cname', y='pageStartPosition', points=False,
title='長期連載作品の掲載位置')
fig.update_traces(scalemode='count', meanline_visible=True, width=1)
fig.update_layout(violinmode='overlay', violingap=0)
fig.update_xaxes(title='作品名')
fig.update_yaxes(title='掲載位置')
show_fig(fig)
6.3.3. 長期連載作品の話数毎の掲載位置の分布#
# 話数の区切り
UNIT_EP = 200
cnames = df_plot['cname'].unique()
for cname in cnames:
df_c = df_plot[df_plot['cname']==cname].reset_index(drop=True)
df_c['eprange'] = (df_c.index + 1) // UNIT_EP * UNIT_EP
df_c['eprange'] = df_c['eprange'].apply(
lambda x: f'{x}話以降')
fig = px.violin(
df_c, x='eprange', y='pageStartPosition', points=False,
title=f'{cname}の掲載位置')
fig.update_traces(scalemode='count', meanline_visible=True)
fig.update_layout(violinmode='overlay', violingap=0)
fig.update_xaxes(title='作品名')
fig.update_yaxes(title='掲載位置')
show_fig(fig)